The focus of the module was hurricanes and the maps focus on studying the effects of storm surge from Hurricane Katrina on three counties from the state of Mississippi, Hancock, Harrison and Jefferson.

The first map is the base map for the study and shows the elevation, bathymetry and hydrography of the three counties and surrounding areas including barrier islands, rivers, swamps/marsh land and population centers that could possibly be affected by the storm surge related to the Hurricane. The map uses an elevation raster layer to show which areas are low lying and potential flood dangers.
Big challenges in putting the map together were deciding what to label and making sure the labels did not conflict or otherwise become displaced in a visually unappealing way and figuring out the best way to frame the main map with other map elements such as the legends to best effect. The second was a big challenge because the actual features displayed in the map are not uniformly regular on a horizontal plane but were rather diagonal. So a big task in map layout was finding a way to cover a large white space in the upper left section of the map. Legends were used for the purpose but for some reason I had a tremendously difficult time lining them up properly.
The label manager tool really came in handy for this map. I had decided with the population centers that it would be valuable to show them categorized by population and doing so made it clear which ones should be labeled since only seven had populations over 10,000. The label manager's SQL query allowed me to label only those seven places. A similar technique was followed with the rivers. Because the layer is so extensive and includes streams and other linear water features, it made sense to only label shapes that were actually tagged as rivers. Offsetting features in the label manager also made a big difference especially in making the island labels legible (and helping fill a lot of blue space). Finally, I could not get the Hancock County label to fit properly so I used the label manager to display the other two county labels and created one for Hancock using the drawing tools.
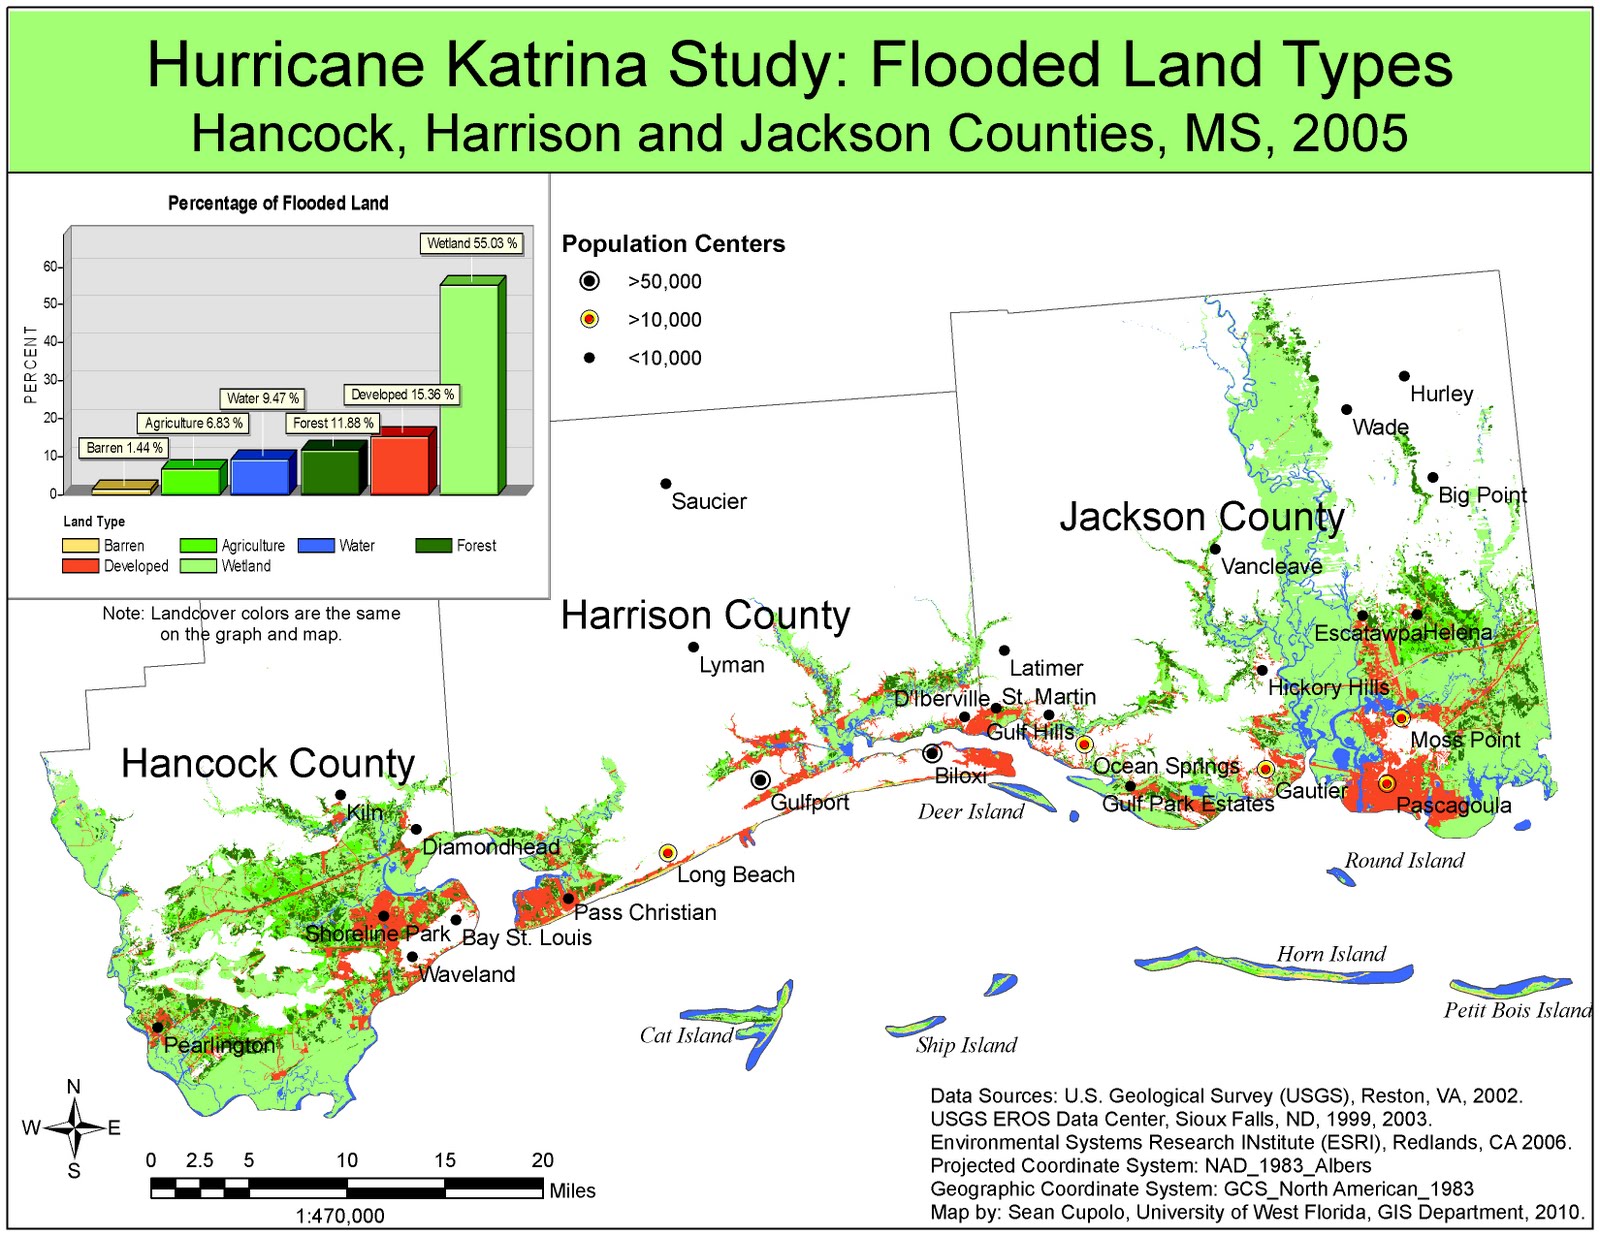
The next map is combined with a chart based on the data from the map and together the two show which land types were flooded by the Hurricane in the same three Mississippi counties. The map was created using some of the more powerful spatial analysis tools that are available with ArcGIS that make it a good tool for the type of analysis done. The elevation layer from the previous map was analyzed to isolate land that is lower then 15 feet above sea level, the height of Katrina's storm surge in Mississippi. The initial land cover layer which shows various types of land was then combined with the below 15 foot layer and the data in the initial land cover file was reclassified to the simpler types shown in the map. Once all that was done a graph was made using ArcMaps graphing tools and added to the map. I spent a lot of time playing with the graph to get it to display the way I wanted, there were many advanced features available. Some of the ones I really liked were being able to match the colors to the map so that I could use the graph legend as a map legend as well, also the labels on each bar graph showing the actual percentage give the graph some weight and visual appeal.

The final map shows infrastructure, particularly roads, railroads, hospitals and churches that were potentially affected by the Hurricane storm surge. Additionally, the map shows churches and railroads that were potentially not affected which could be used as relief centers and supply conduits respectively. The map, due to the vast road network displayed would have been a bear to get finished if not for a tip from another student about using the Map Cache toolbar which presumably creates a memory cache for you map and enables redraws to occur really quickly. Don't know how I'd have gotten the map done without that as I had a lot of trouble getting the road symbols to work. The road file had about 39,000 records in it I believe, each on a shape one the map.
All in all, I'm pretty happy with these three maps, they were a lot of work.

Awesome job Sean! You once again set the bar high! I also struggled with the horizontal plane and like how you handled it. I also love how you included the population legend and limited the places to those only over 10,000 ppl. Smart fella!
ReplyDelete