Friday, March 19, 2010

Week 9 - Vector Analysis II

The posted map was completed for the Week 9 Lab for the University of West Florida Online GIS Certification program class, Introduction to Geographic Information Systems (GIS 4043/L). The map was created using the ArcGIS ArcMap program.


This was a fun lab. I learned a lot and was challenged to think through the steps to get what was needed. I enjoyed this one quite a bit.

Lab Questions

Q1: Which tool was used: I used the Identity tool because it combines portions of features that overlap. The end results gave me the exact same set of overlay features as the Union overlay (I laid them on top of each other to verify). However, the intermediate step when the overlay was applied looked quite different as several areas were "missing". This makes sense when you look at the graphical depictions and read the overlay descriptions in the lab because Union combines features from both layers but Identity only combines portions of features that overlap. In this case because the road was my input feature the overlay created essentially matches the road buffer such that when over-layed on the original Union overlay you can see the discrepancies (See image below).


Off course now that I went to all this trouble I realize that I could have probably just used the Intersect Overlay and saved myself a step (and I thought I was being clever).

Q2 Which tool to exclude conservation areas: The Erase tool was used to exclude conservation areas because it excludes areas in the erase feature, here the conservation_area layer, that overlap the input feature or in our case the buffers_union layer.

Q3 How many features were in the possible sites layer: There were 79 features in the layer, the largest had an area of 7,765,034.49 Sq. Meters (7.7 Sq Km) and the smallest was 748.11 Sq. Meters.

Monday, March 15, 2010

Spring Break Fun!

The posted map was completed as an optional exercise during Spring Break the University of West Florida Online GIS Certification program class, Introduction to Geographic Information Systems (GIS 4043/L). The map was created use ArcGIS based on recent data downloaded from the State of Florida Department of Revenue.


The goal of the exercise was to take a ArcGIS shapefile of land parcels for Gulf County, Florida and join the parcel data to associated Tax Roll Data that was compiled as a table into a Comma Separated Value (CSV) file then use the information and the ArcGIS functions to determine the top four landholders in the county.

The instructions for the exercise were straightforward as was using ArcGIS to compile and analyze the information to obtain the desired result, a testament to the power and utility of a GIS system, particularly when the sources exist to provide the desired information. As someone with a lot of database and file conversion experience, I was very comfortable using the tools that are available in ArcMap much to my delight. I actually spent more time trying to compose a visually interesting map that displays the data in an easily identifiable way. Hopefully the final map outputed here does so.

Tuesday, March 02, 2010

Week 7 Data Editing in ArcGIS

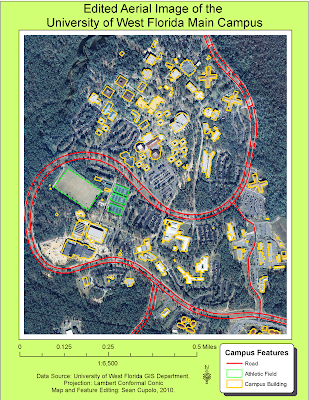
The posted map was completed for the Week 7 Lab for the University of West Florida Online GIS Certification program class, Introduction to Geographic Information Systems (GIS 4043/L). The map is the same as was posted for the Week 6 Lab but several features have either been edited or added to the vector shapefiles on the map including adding a new feature shapefile for Athletic fields.


The lab was pretty straight-forward and required following the steps learned in the previous part of the lab as part of the ESRI Learning ArcGIS class. The only tip I could offer is to be patient while digitizing and do not be afraid to delete and start over.